OTT refers to delivering film and T.V. content online without satellite or cable connections. An EMarketer survey revealed that more than 56 million had cut the cord on cable in America. Because of rising in on-demand video content, more people converted to OTT delivery services. Here we compiled the top 50 OTT Video Marketing and Advertising Predictions and Trends for 2024.
OTT Marketing and Advertising Predictions And Trends For 2024
-
- A rise in internet penetration and demand for content marketing within the entertainment industry is expected to grow globally in the OTT service market.
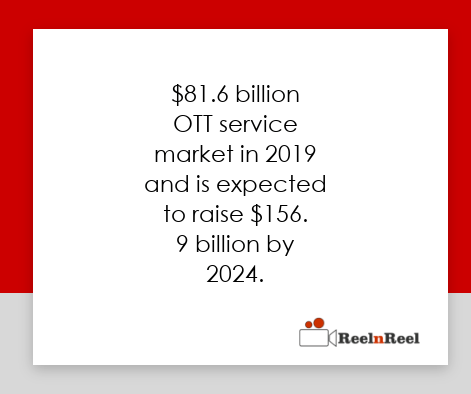
- The $81.6 billion OTT service market in 2019 is expected to raise $156—9 billion by 2024.
- Transactional-based online gaming in the OTT market is recorded as the fastest growing compared to subscription-based in the OTT service market.
- OTT TV and Video streaming revenue is predicted to reach $18,369 by 2021.
- eMarketer predicts that 73.1 % of the U.S. internet users use the OTT market services y 2021.
- Ads delivery on the OTT platform is 100% viewable and non-skippable because they run in real-time. So, 90% of the ads are viewed on the OTT platform.
- According to a survey of U.S. marketing professionals, 48% of the videos streaming on T.V. screens other than Live T.V.
- In the survey by U.S. Marketers over OTT services, 50 % of the streaming videos appear on the screen, such as T.V., Mobiles, and Desktops other than Live T.V.
- More than 76.7% of the U.S. population used OTT services in 2019.
- It’s a prediction by the OTT Marketers that connected to T.V. users will rise by 57.2 % to 60.1% in the U.S. by the end of 2024.
- At the movement, Video-on-demand penetration in Western Europe is 12.69%, expected to be a 20.24% rise by 2021.
- OTT streaming services in the U.K. have potential growth from 2018- 2021. In 2018 it was 31.86%, and it’s raised to 54.23% by 2021.
- Online video streaming trends indicated that internet use would rise by 82% by 2024.
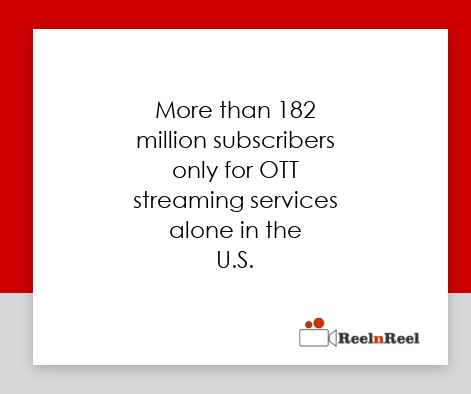
- More than 182 million subscribers are only for OTT streaming services in the U.S.
- Netflix spent over $12 billion only on digital video content in 2019 and is expected to increase by $16 billion by 2024.
- Smartphone devices are projected as one of the lucrative segments globally on the top market.
- The entertainment and media industry held a prominent position in 2017, and marketers predict it will continue to grow until 2025.
- By region-wise, during 2018-2025, Asia-pacific would exhibit the highest CRGA of 20.8%.
- By 2025, There will be an emergence of new OTT marketers expected to be over a billion middle tire consumers.
- Over $198 billion users are the estimated number of OTT by 2021.
- OTT media services are striving hard to create niche content for further years.
- Marketers in the U.S. predict that Over the Top content users will reach $156.9 billion by 2024.
- 54% of growth was noticed in over-the-top services’ previous year Globally.
- Hulu is one of the best examples which offers on-demand video streaming services.
- According to ComScore,75% of people spend their time streaming videos connected to T.V.s such as Amazon, Netflix, Hulu, and YouTube.
- In 2018 OTT advertising hit $2.7 Billion in revenue.
- Netflix and Amazon are the major competitors in the global market.
- Hulu, one of the top OTT advertising market leaders, reached an ad revenue of $1.5 Billion in 2018, a 45% growth over the year.
- Roku acquired $ 416 million in 2018, which was generated from advertising.
- The average length of OTT advertising in the U.S. is 3.2 minutes, which will hit 5.1 minutes by 2021.
- In 2021 OTT advertising might reach $5 Billion.
- The audience watching ad-supported OTT programs gained a 3.8 times higher retention rate.
- In the United States, households 54 hours per month of OTT streaming on average.
- We can find a 26% increase in home data usage over OTT streaming.
- 81% of people between 30 to 49 are surfing OTT programs.
- 68% of hours are spent by people aged 30-49 on OTT streaming.
- The OTT consumers will quit the video ad 85% to 95% of the time.
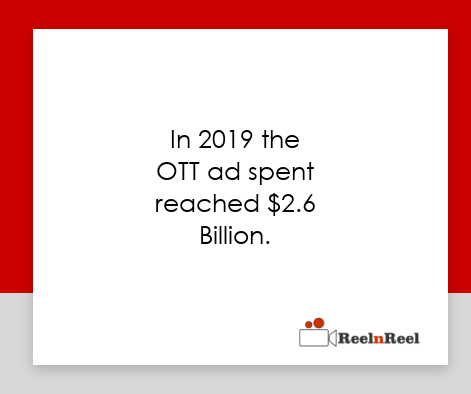
- In 2019 the OTT ad spent reached $2.6 Billion.
- By 2021 the OTT advertising revenue will be the primary source of $8,745 Million.
- OTT TV and Video revenue will reach $18,396 Million by 2021.
- The OTT or CTV viewers complete 98% of video ads compared to other devices.
- Subscription video-on-demand service will obtain a global revenue of $69B by 2023.
- In the U.S., 14 Million households use OTT or CTV streaming services.
- The consumers own 8.6% Apple T.V., 7.8% of Google Chromecast, 7.1% Roku Streaming Players, 3% of Amazon Fire T.V. sticks, 2.2% Roku streaming sticks, 1.6 % of TiVo Roamio and 1.2% of Boxee T.V.
- The ad spent on Roku accounts for 67% higher exposure when compared with cable television or broadcast.
- CTV advertising holds 26% of the total video ad spent.
- 60% of OTT consumers said they use mobile to watch video content.
- By 2021 the time spent by users watching the video through OTT apps raised to 27%.
- We can find 182 Million OTT streaming platform consumers in the U.S.
- Cloud processing is the most adopted trend of OTT platforms to stream video content.
Conclusion
OTT video advertising and Marketing can hit the sales funnel when the content production projects quality over quantity. Most business brands adopt multiple streaming platforms to promote their business to real-time audiences.


