


Instagram has evolved from a photo-sharing app to a dynamic platform that embraces video content as a powerful means of expression, connection, and marketing. As video continues to dominate the social media landscape, understanding Instagram video statistics and trends is crucial for marketers, content creators, and businesses aiming to maximize their reach and engagement on the platform. This compilation of 50 astounding Instagram video statistics and trends will provide valuable insights into the platform’s ever-changing ecosystem, helping you craft more compelling video content strategies.
50 Instagram Vide Statistics And Trends
-
- According to 2019 stats, 60% of the videos on Instagram are viewed with Sound on.
- 80% of the Instagram stories discovered with voiceover and music performed better than ads.
- Instagram makes shopping easy for shoppers; 70 % of Instagrammers are willing to explore the brands and create brand awareness through Instagram ads.
- Over 130 million users tap on Instagram hashtags each month by 2020.
- Instagram IGVT changes the Instagram trends; it just reassembles TikTok videos. Over one billion accounts are active every month on Instagram.
- More than 80% of Instagram Followers follow at least one business account on Instagram.
- Instagram offers the best influencers for brands. Over 60% of the business accounts on Instagram implement interactive elements through Stories.
- Instagram is exploring its ads program on its feed, with 50% of the accounts using exploring feed every month.
- More than 200 million Instagrammers check the Instagram grid every day.
- #Love is the most used hashtag on Instagram, used more than 1.7 billion times on Instagram posts.

- Instagram stands as the second most downloaded app in the app store.
- 62% of Instagram users say they watch product videos before buying a product.
- Few Instagram emojis are recommended for best performance, such as 24 emojis in carousals’, 20 emojis in image posts, and 24 emojis in video posts.
- According to 2019 statistics, Instagram discovered that 71.9% of the image posts, 13.9% of the carousels, and 14.2 % of the posts are videos.
- 50% of Instagram users follow the brands, and this is noted as the highest number of followers for brands among all social media.
- 92% of the users on Instagram trust UGC more than traditional ads.
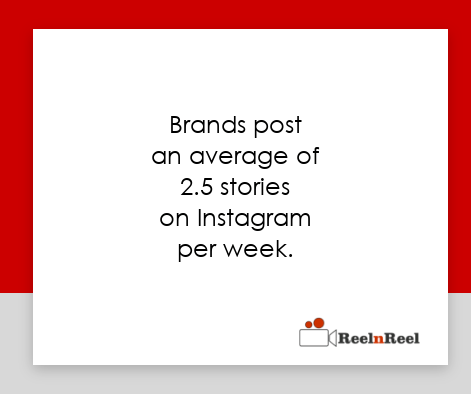
- Brands post an average of 2.5 stories on Instagram per week.
- In a day, 4.2 billion times hit the Like button on Instagram.
- An average User on Instagram engages in the afternoon between 1 PM and 5 PM.
- More than 45.7% of Instagram posts contain questions, but it has been proven that it does not lead to more engagement.
- 12.32 billion ad revenue generated for Instagram by 2020.
- 849.3 million is the average advertising reach for Instagram users by 2020.
- The biggest demographic for Instagram is males aged between 18 and 24.
- 48% of the males used Instagram, and 52% of the Females used Instagram Accounts.
- In the U.S., 73% of teens trust Instagram as the best way to showcase brands.
- Instagram has 1 billion active users, and its growth will be 13% by 2018.
- 20% of the brands on Instagram use videos with higher engagement than photos, and the length of the Instagram video is 30 seconds.
- Generally, the videos on Instagram look like video posts, but they are tagged as ‘sponsored.’
- Above 500 million users use Instagram stories, and 50% of businesses on Instagram upload their brand stories.
- We can find over 8 million business profiles on Instagram, with 2+ million monthly active advertisers.
- Almost 43% of Facebook accounts are taken up by Instagram advertising.
- Monday, Wednesday, and Thursday are the best engaging days to post on Instagram.
- Instagram contributed 10.6% of revenue to Facebook’s ad revenue in 2017.
- The video posts on Instagram find 2x better engagement than other posts.
- 4.2 million app installations take place to use IGTV, and 7,700 new IGTV installations occur daily.
- 80% of Instagram users follow business brands to find the products or services.
- Year over year, 80% of the growth rate of video views can be observed on Instagram, quadrupling since 2017.
- Almost 50% of business brands generate at least one Instagram story per month, and the businesses produce 33% of the most popular Instagram stories.
- Most influencer collaboration occurs only on Instagram, and 7 out of 10 ‘#’ hashtags on Instagram are brand-related.
- 25% of Instagram ads are single video types with a length of 60 seconds.
- In 2019 Ins,tagram influencer marketing was raised to 48%.
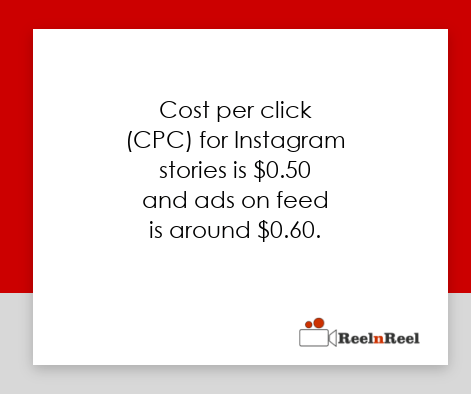
- Cost per click (CPC) for Instagram stories is $0.50, and ads on feed are around $0.60.
- The cost per impression (CPM) for stories is $0.90, and the Instagram feed is $1.65.
- By edging videos, 60% of Instagram users became influencers and celebrities.
- 4.2 million downloads of IGTV, which supports landscape videos, have been downloaded since the start date of 2019.
- 73% say that Instagram stories are more effective for influencer marketing.
- Brand engagement on Instagram is higher than brand engagement on Facebook.
- In Q1 2017, 5.2 million Instagram audience watched branded videos.
- Sponsored videos on Instagram generate 3x more comments when compared with sponsored photos on Instagram.
- The top influencers on Instagram post 6 to 7 stories each day.
Conclusion
The 50 Instagram video statistics and trends highlighted in this overview demonstrate the platform’s incredible growth and potential for video content. As Instagram continues to evolve and expand its features, it is evident that video will remain a critical component of the platform’s strategy and user experience.